Platform Features
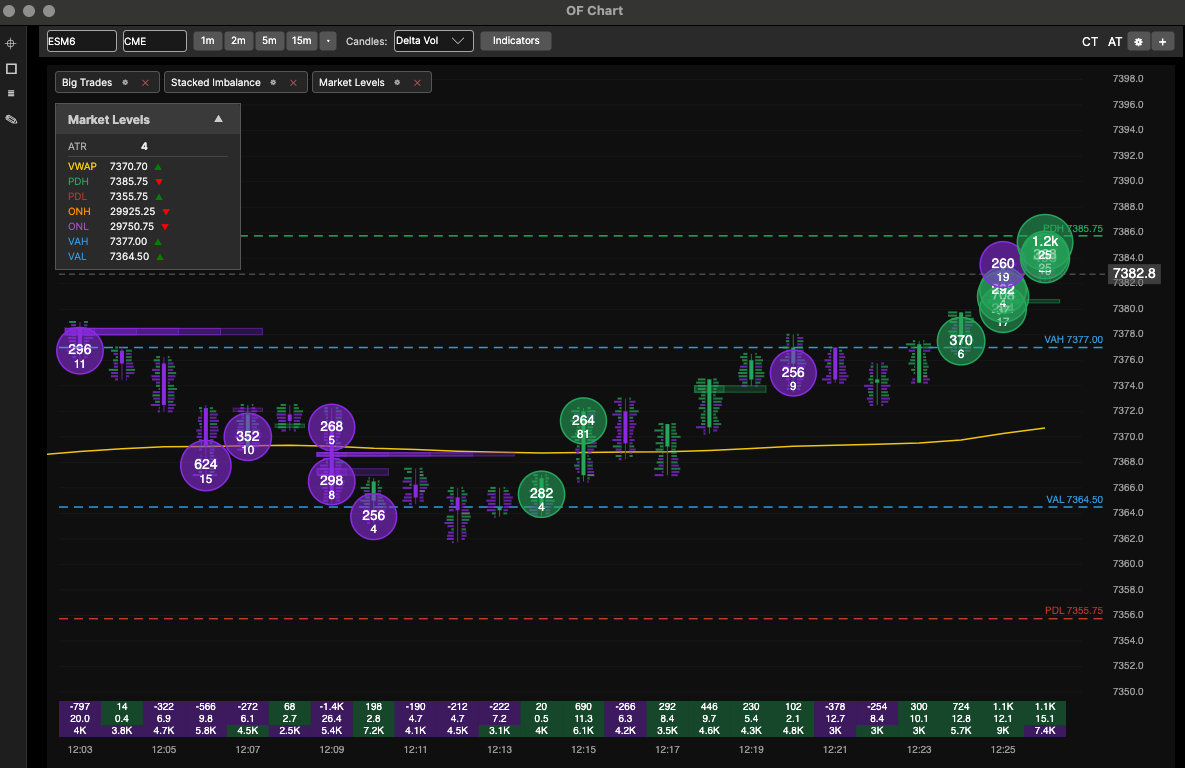
Big Trades
See exactly where large orders hit the market in real time. Instantly identify where institutions and high-volume traders are buying or selling, so you can align yourself with the moves that matter most.
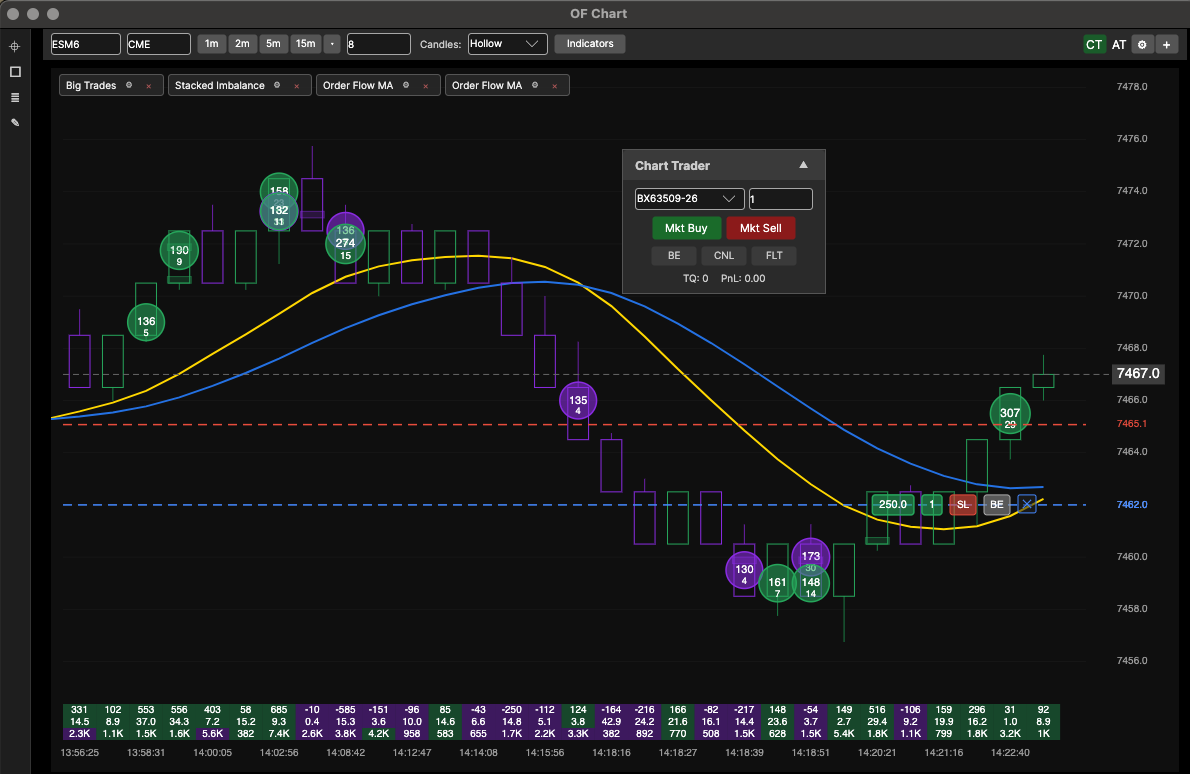
Chart Trader
Trade directly on the chart with a full execution panel. Displays real-time profit and loss, supports drag-and-drop stop loss and take profit levels, and includes a one-click BE button to move your stop to break even — giving you complete control without leaving the chart.
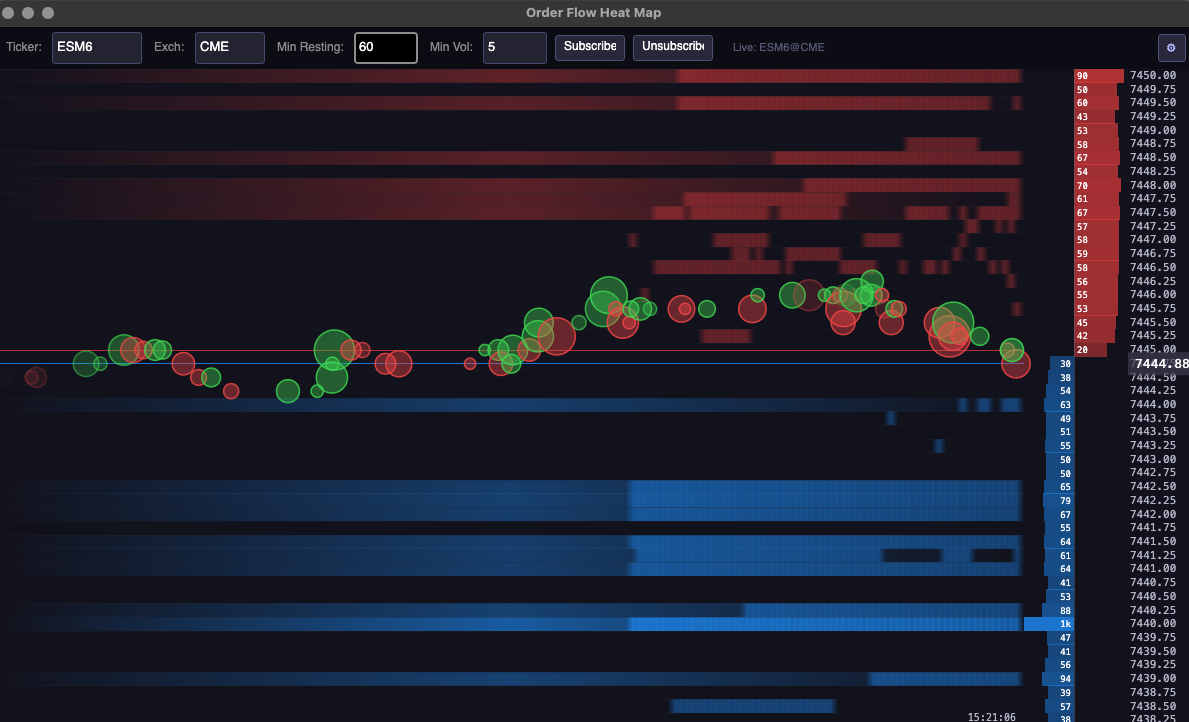
HeatMap
Track where liquidity is building with a live order book heatmap. Instantly identify resting orders, support and resistance zones, and where the big money is positioned — long before price gets there.
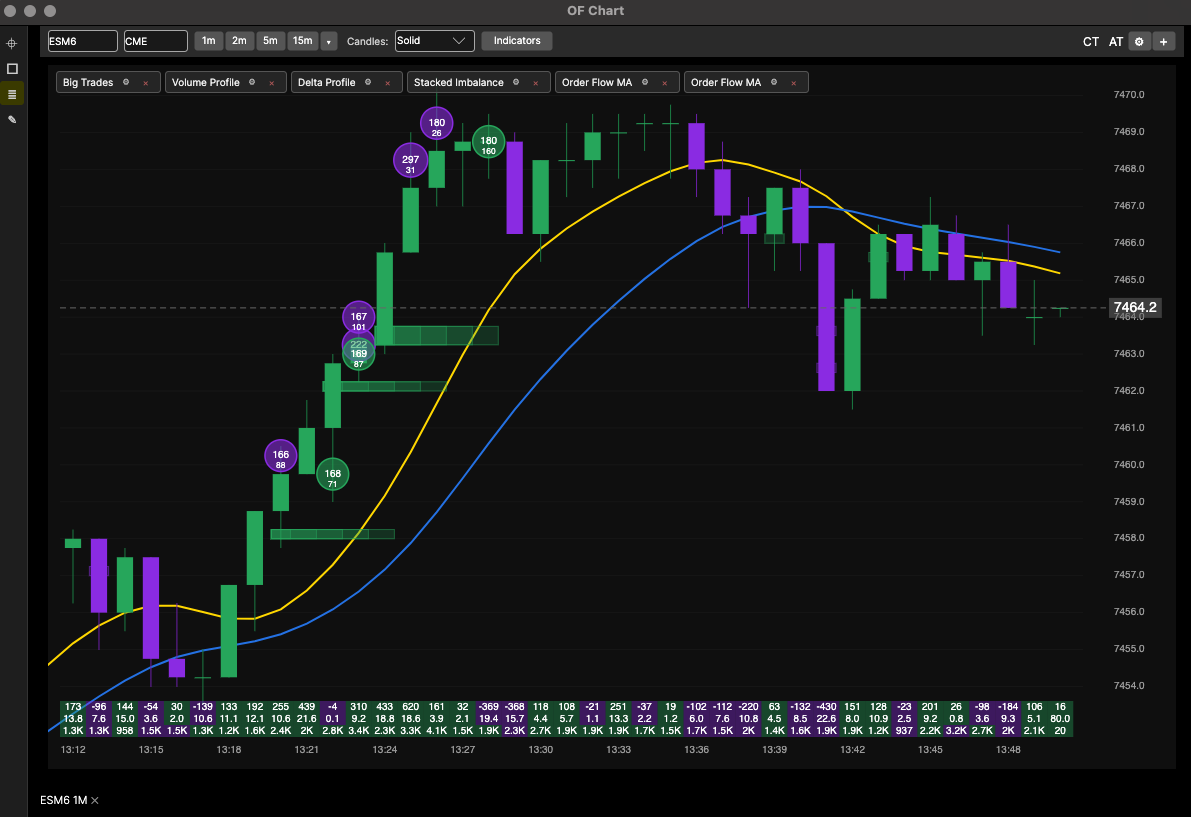
Stacked Imbalance
Visualize order flow imbalances stacked across multiple price levels. Spot absorption zones, aggressive buying or selling pressure, and potential reversals with a clear, color-coded imbalance display.
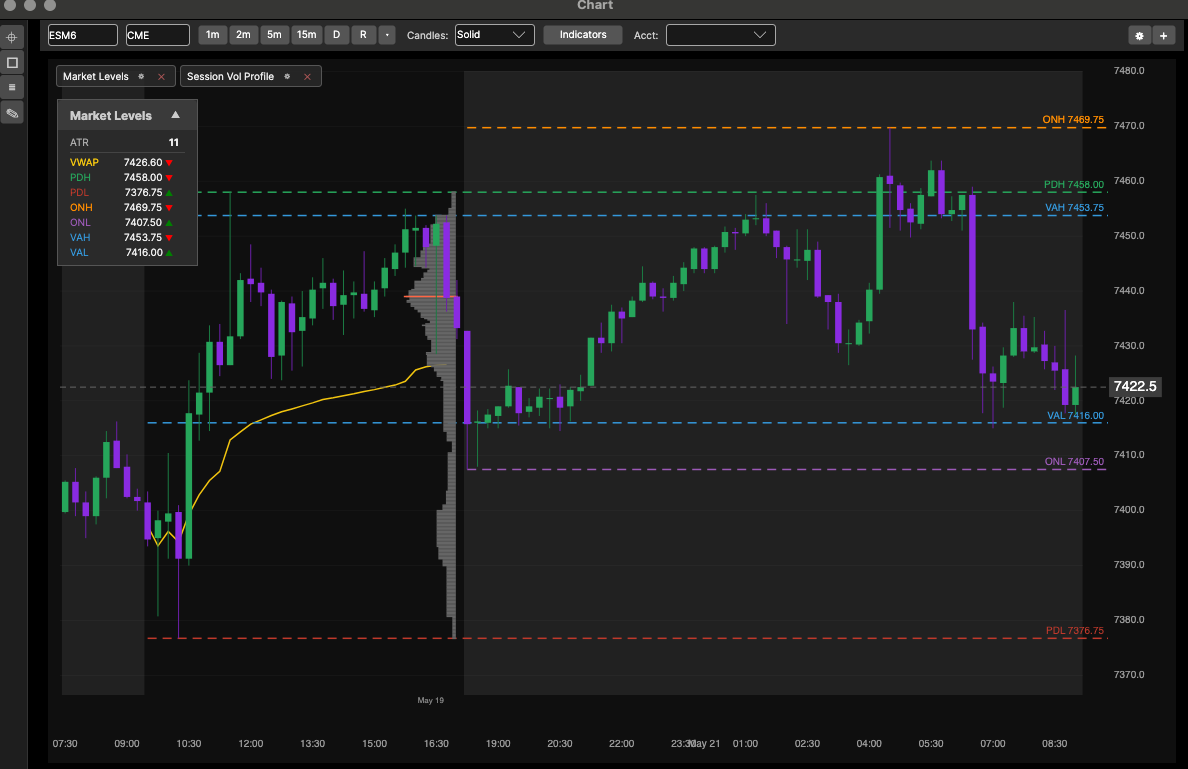
Market Levels
Key reference levels displayed directly on your chart, including yesterday's high and low, opening range, session VWAP, and more. Keep critical price points in view without cluttering your workspace.
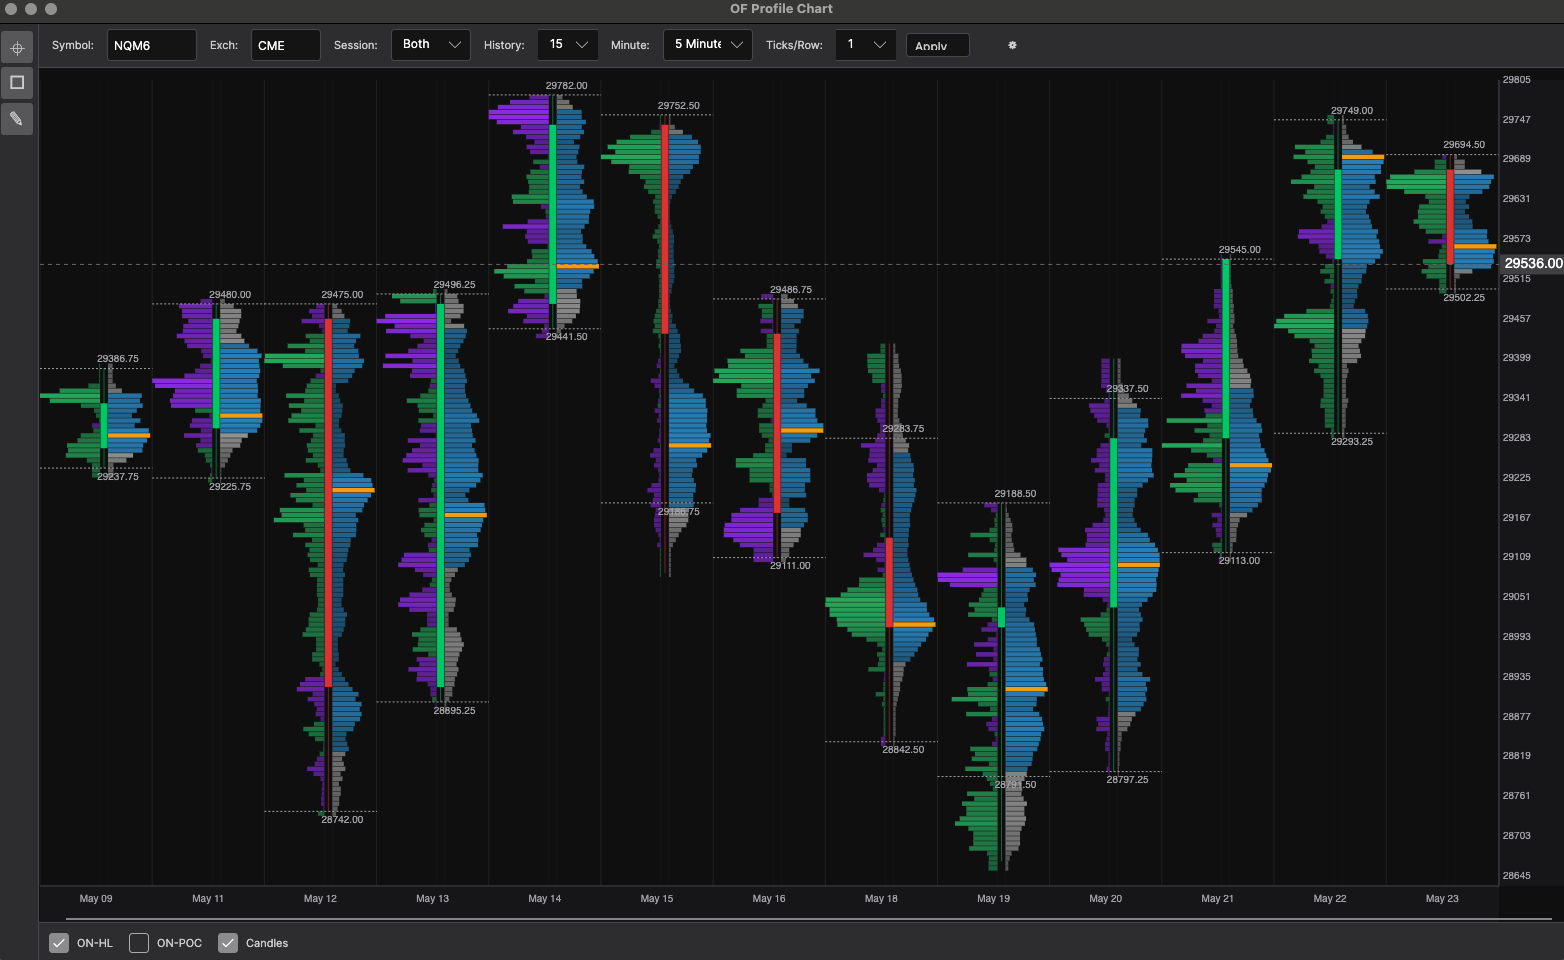
Profile Charts
Analyze market structure with delta and volume profile. Visualize where the most volume traded at each price level, with candlestick overlays for a clear picture of price action and participation.